With CATALYST you can know the likely outcomes for one or more building solutions in real-time - and them more efficiently and effectively navigate through the planning and design process. The following are selected reports and display excerpts that will help you understand what CATALYST produces. In the “How CATALYST Works” page we focus on the Project Set Console. Let’s now look at the Project Overview Console.
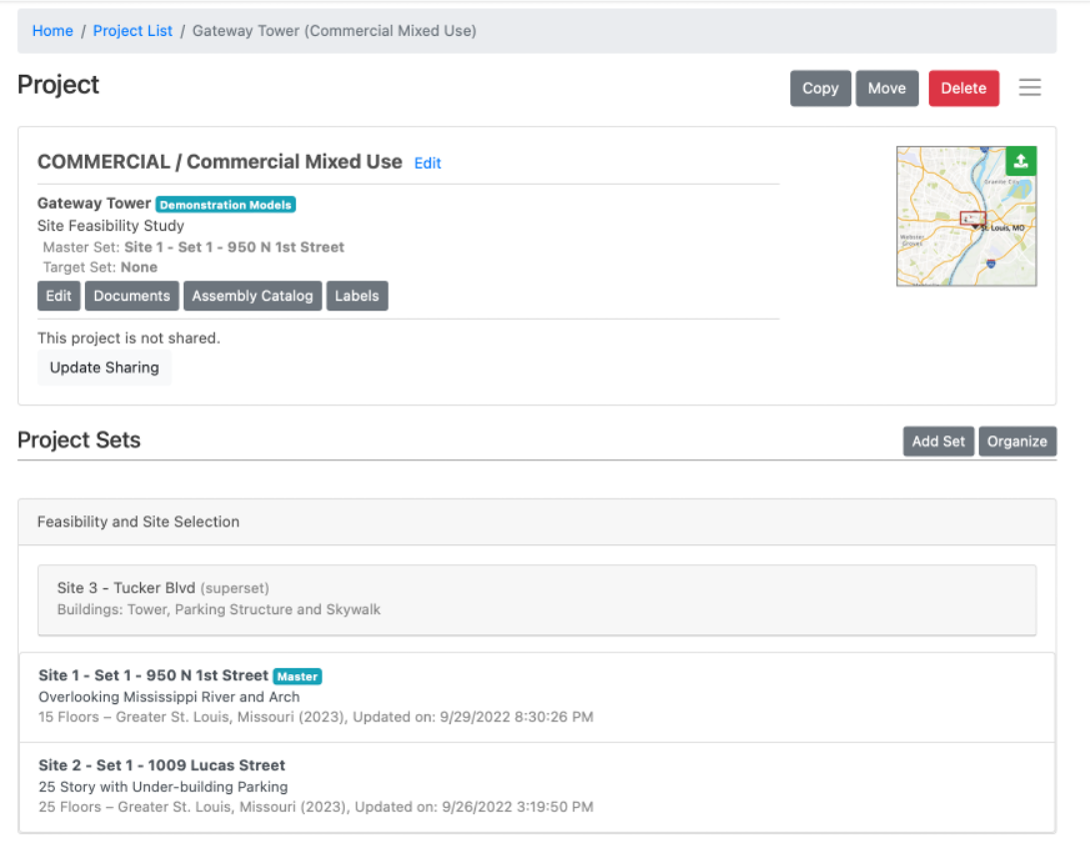
In the upper sections we edit project information, upload documents, assign organizational labels, and share projects outside our organization. We can also copy, move and delete the project here.
The lower section groups and lists Project Sets. In this example we see two major groups: Feasibility and Site Selection and Site 1 Conceptual Design. The first group compares three sites and building concepts. Sites 1 and 2 are single buildings with underbuilding parking. Site 3 includes 3 different building types: Tower, Parking Structure and Skywalk over a roadway connecting the two. CATALYST applies the “Superset” concept that allows you to model these buildings independently, and then aggregate these into one Master Project. See the end of this page for a fun application of Site 3. Supersets are also ideal for Campus Master planning, or complex addition and renovation projects.
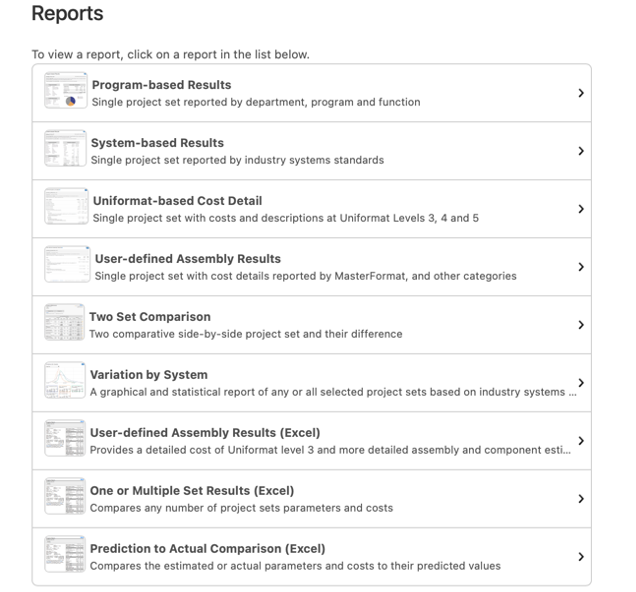
The full range of outputs and reports are accessed from the upper right “hamburger” icon as shown below. Looking again from a Project Set Console.
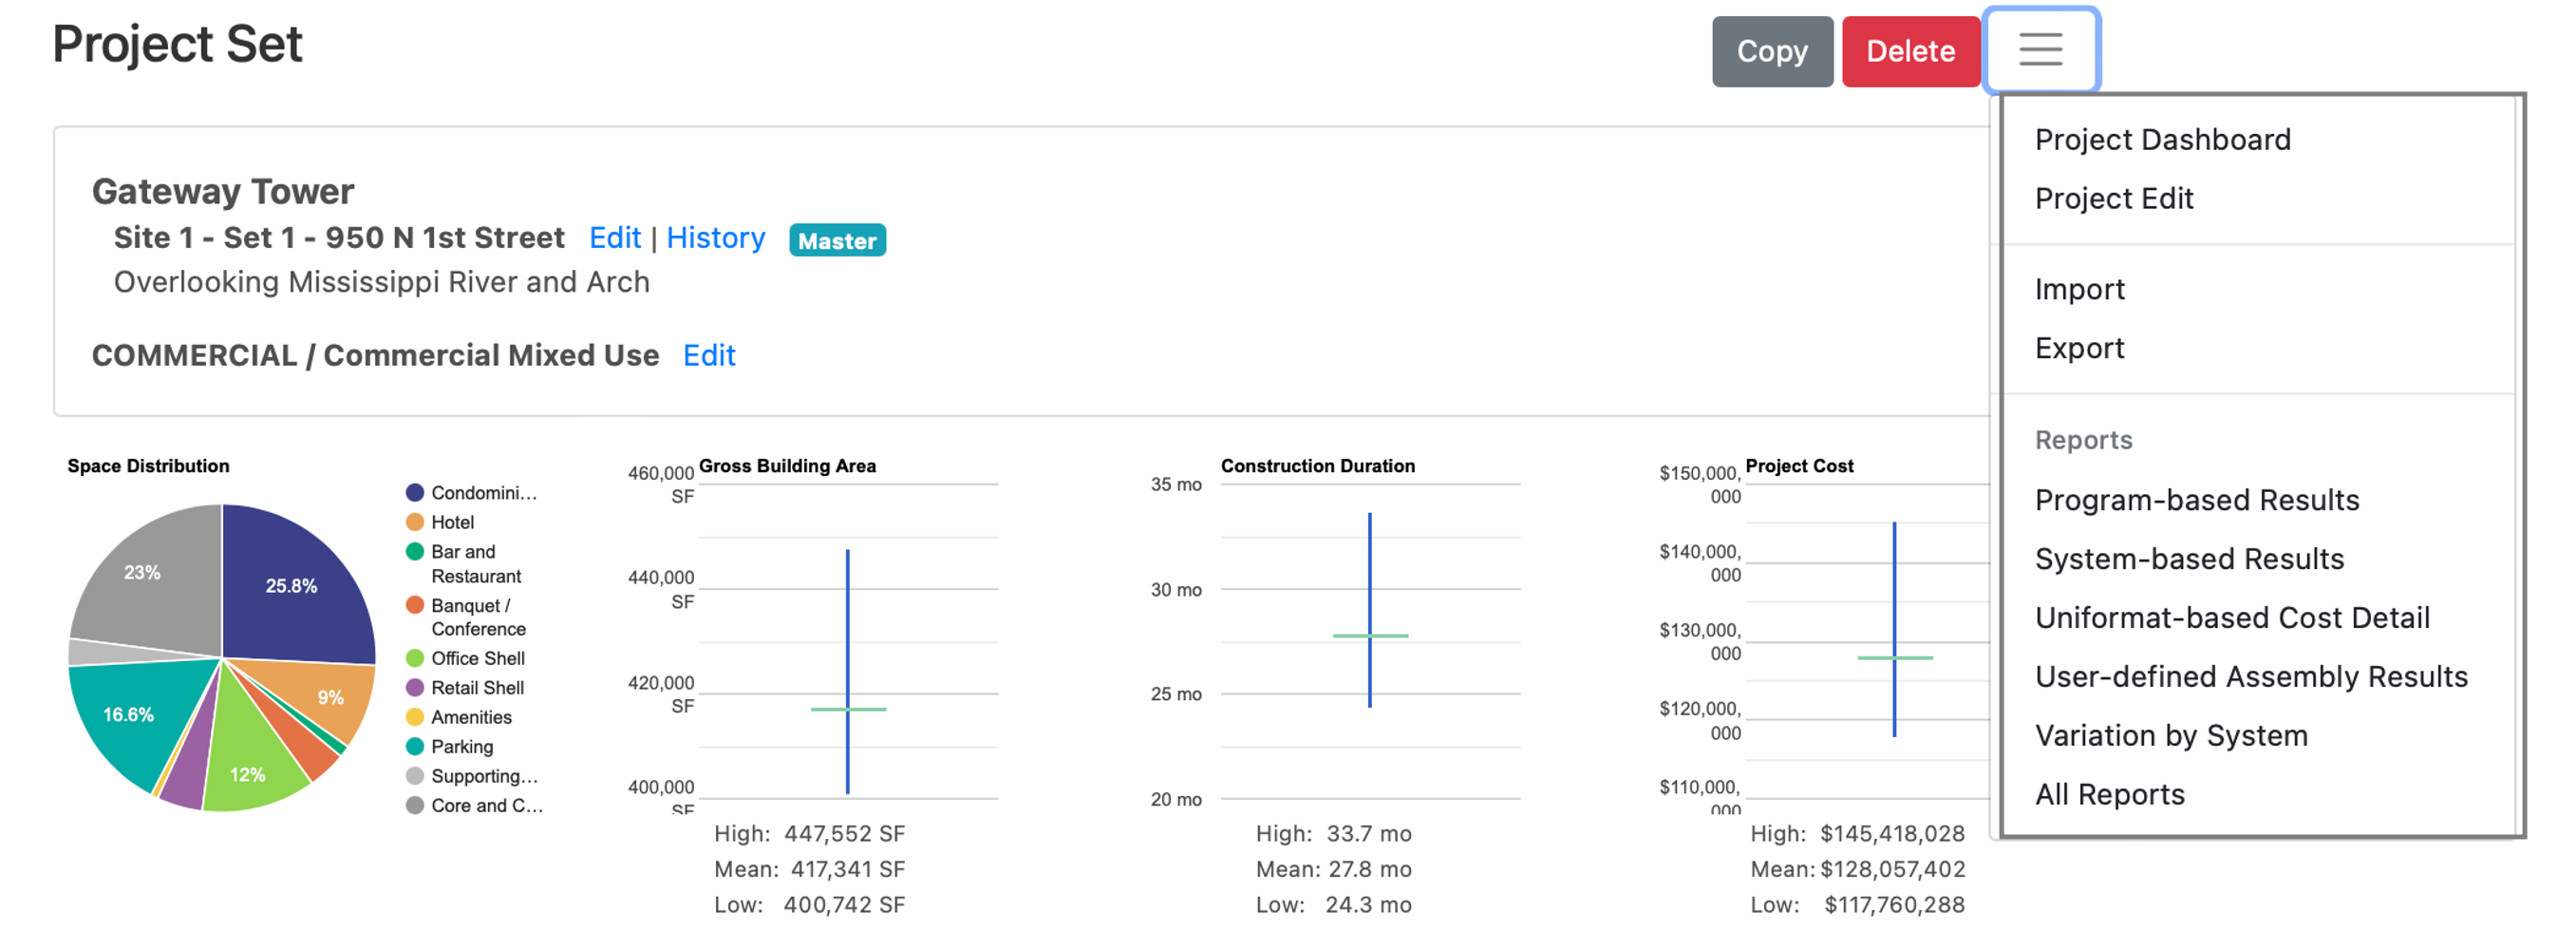
From this dropdown we can select Project Dashboard (see example below), the Project Overview and Edit page, Import or Export. Importing data provides advanced users to integrate CATALYST with other data sources such as detailed estimates, design schedules or space programs. An Exporting example is shown below.
There are a wide range of reporting options as shown at the end of this page.
Let’s look at excerpts from four of these starting with the Program-based Results. You will recall from the How page that prior to staring any space programming or conceptual design Building CATALYST can, with a useful range of variation, produce a:
- Comprehensive space program,
- Scope and design parameter data model,
- Schedule milestone model, and
- Comprehensive cost model.
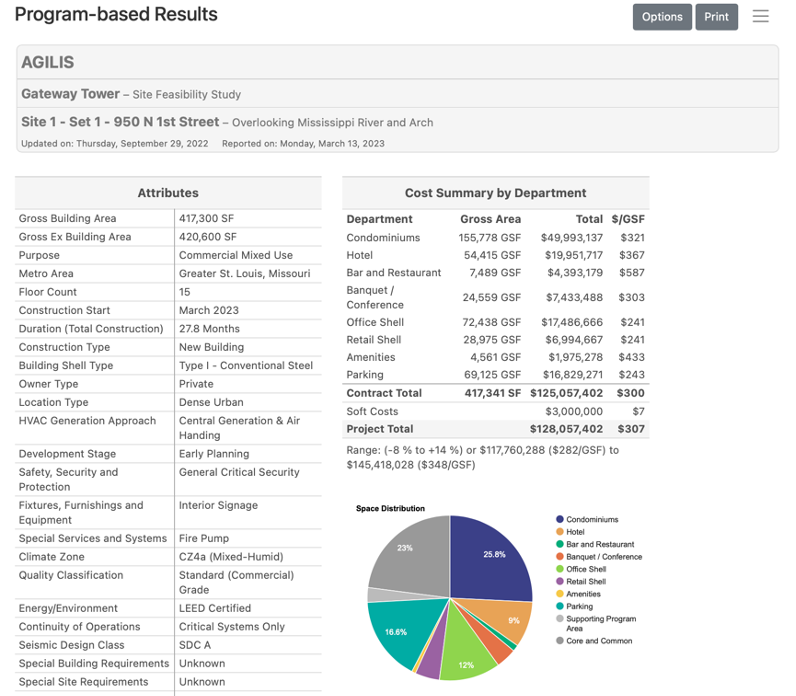
Program-based Results
This high level summary displays – at a glance - Project Set Attributes, Space Program and Cost.
In the next section of this report, we drill into the next level of detail, by breaking out the Sitework, Building Core and Shell and the Supporting Spaces from the Functional Areas. As we saw in the How page, we see again why it is critical to model projects based on the Owner’s Business Case. Some try to do this at the departmental level, but since they’ve had no way of capturing data as such, the basis is essentially as SWAG.
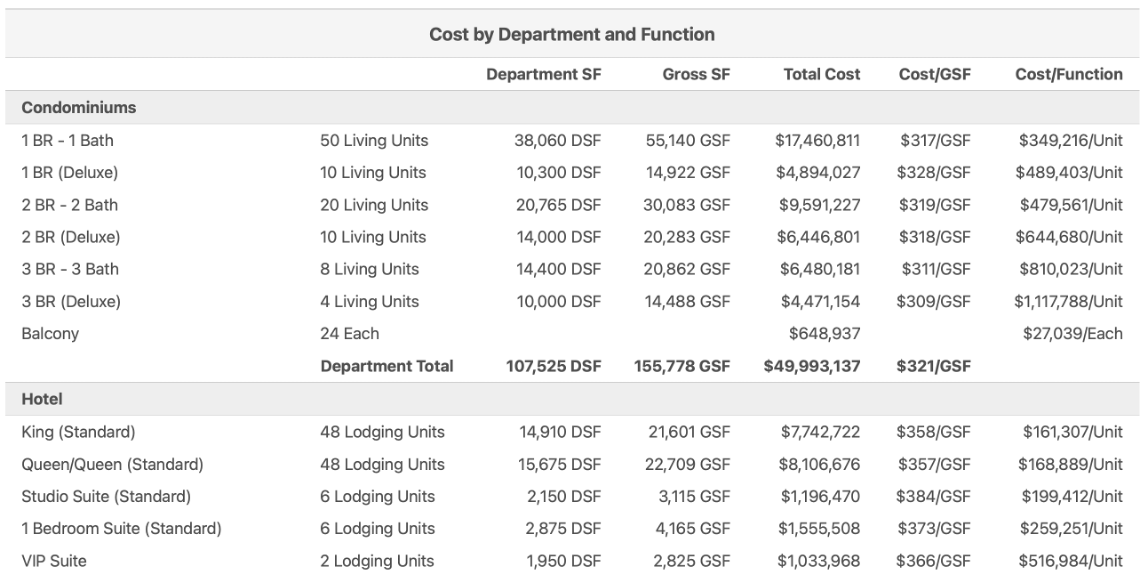
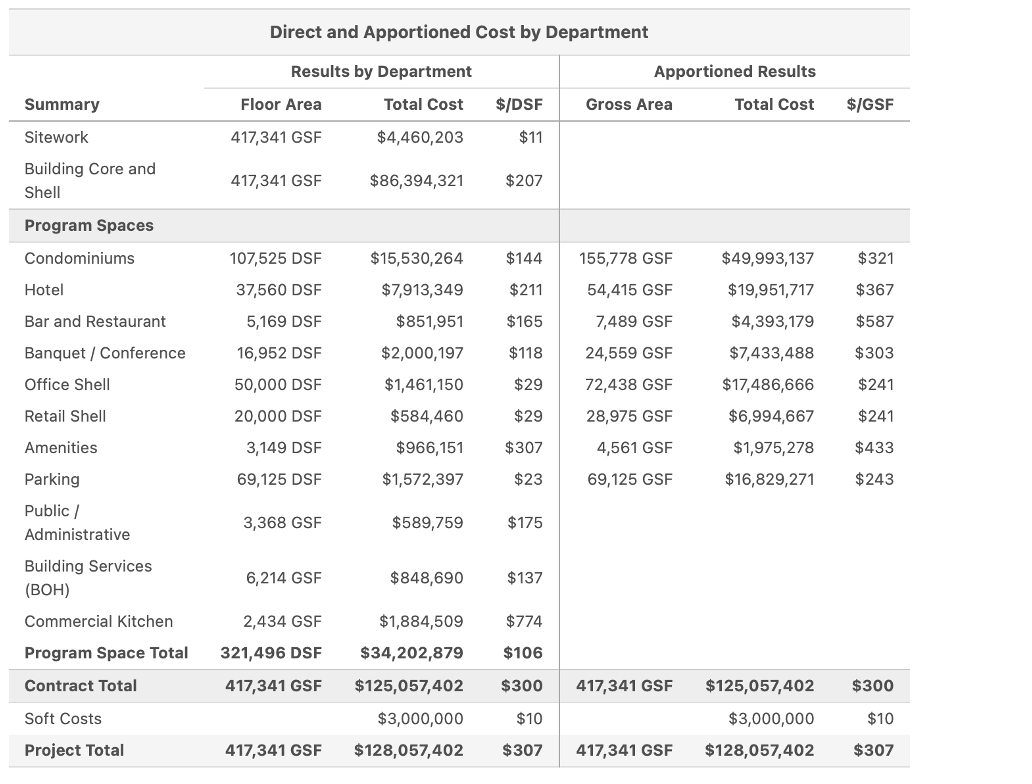 Note the wide range of cost intensity in the interior program areas from Shell spaces at $29/SF to Condos at $144/SF to Commercial Kitchen at $774/SF. The ultimate expression of a facility as a system is achieved when it is directly correlated to the owner’s business case and revenue centers. Because we base all calculations and predictions on the owner’s business case, we can also express the outcomes in the same way. Here, we see the construction cost results only. We are also developing the soft cost and lifecycle costs – even the total cost of ownership – to be expressed in the same way. When complete, owners will have a confident and reliable way to optimize the total life cycle.
System-based Results
It’s important to plan, budget, track, steer, and finally record projects on a ONE DATA System basis. Uniformat provides that basis – all most. As described in the How page, some building systems fit into an overall system at Unformat Level 2, and others at Uniformat Level 3. So we have created a hybrid that we refer to as Uniformat Level 2.5. Here’s the Systems-based Results Summary page.
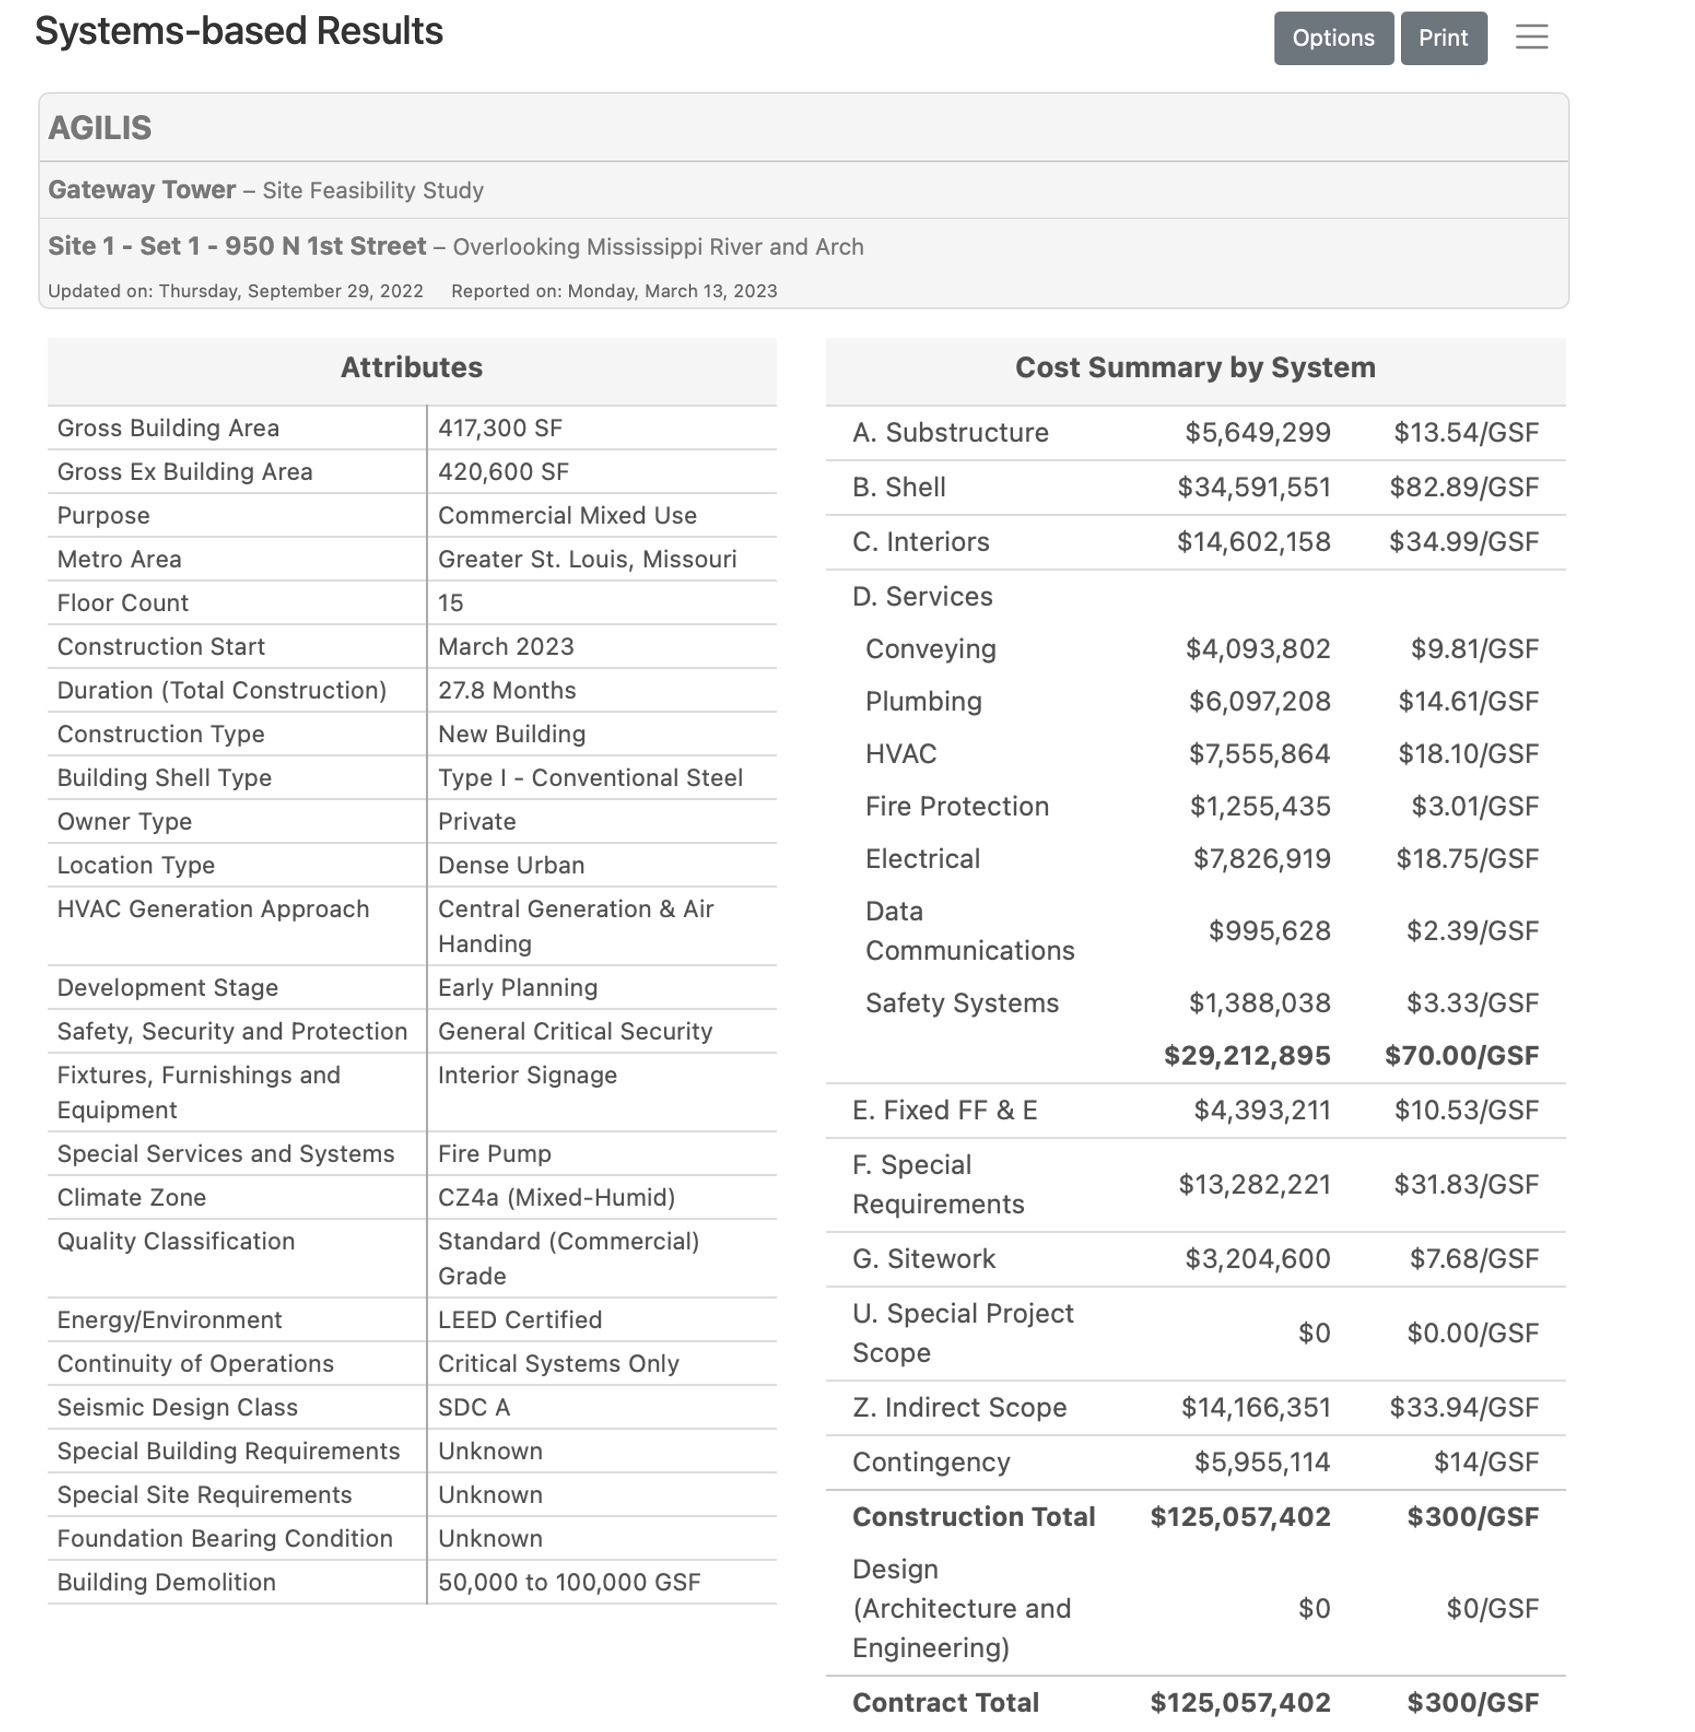
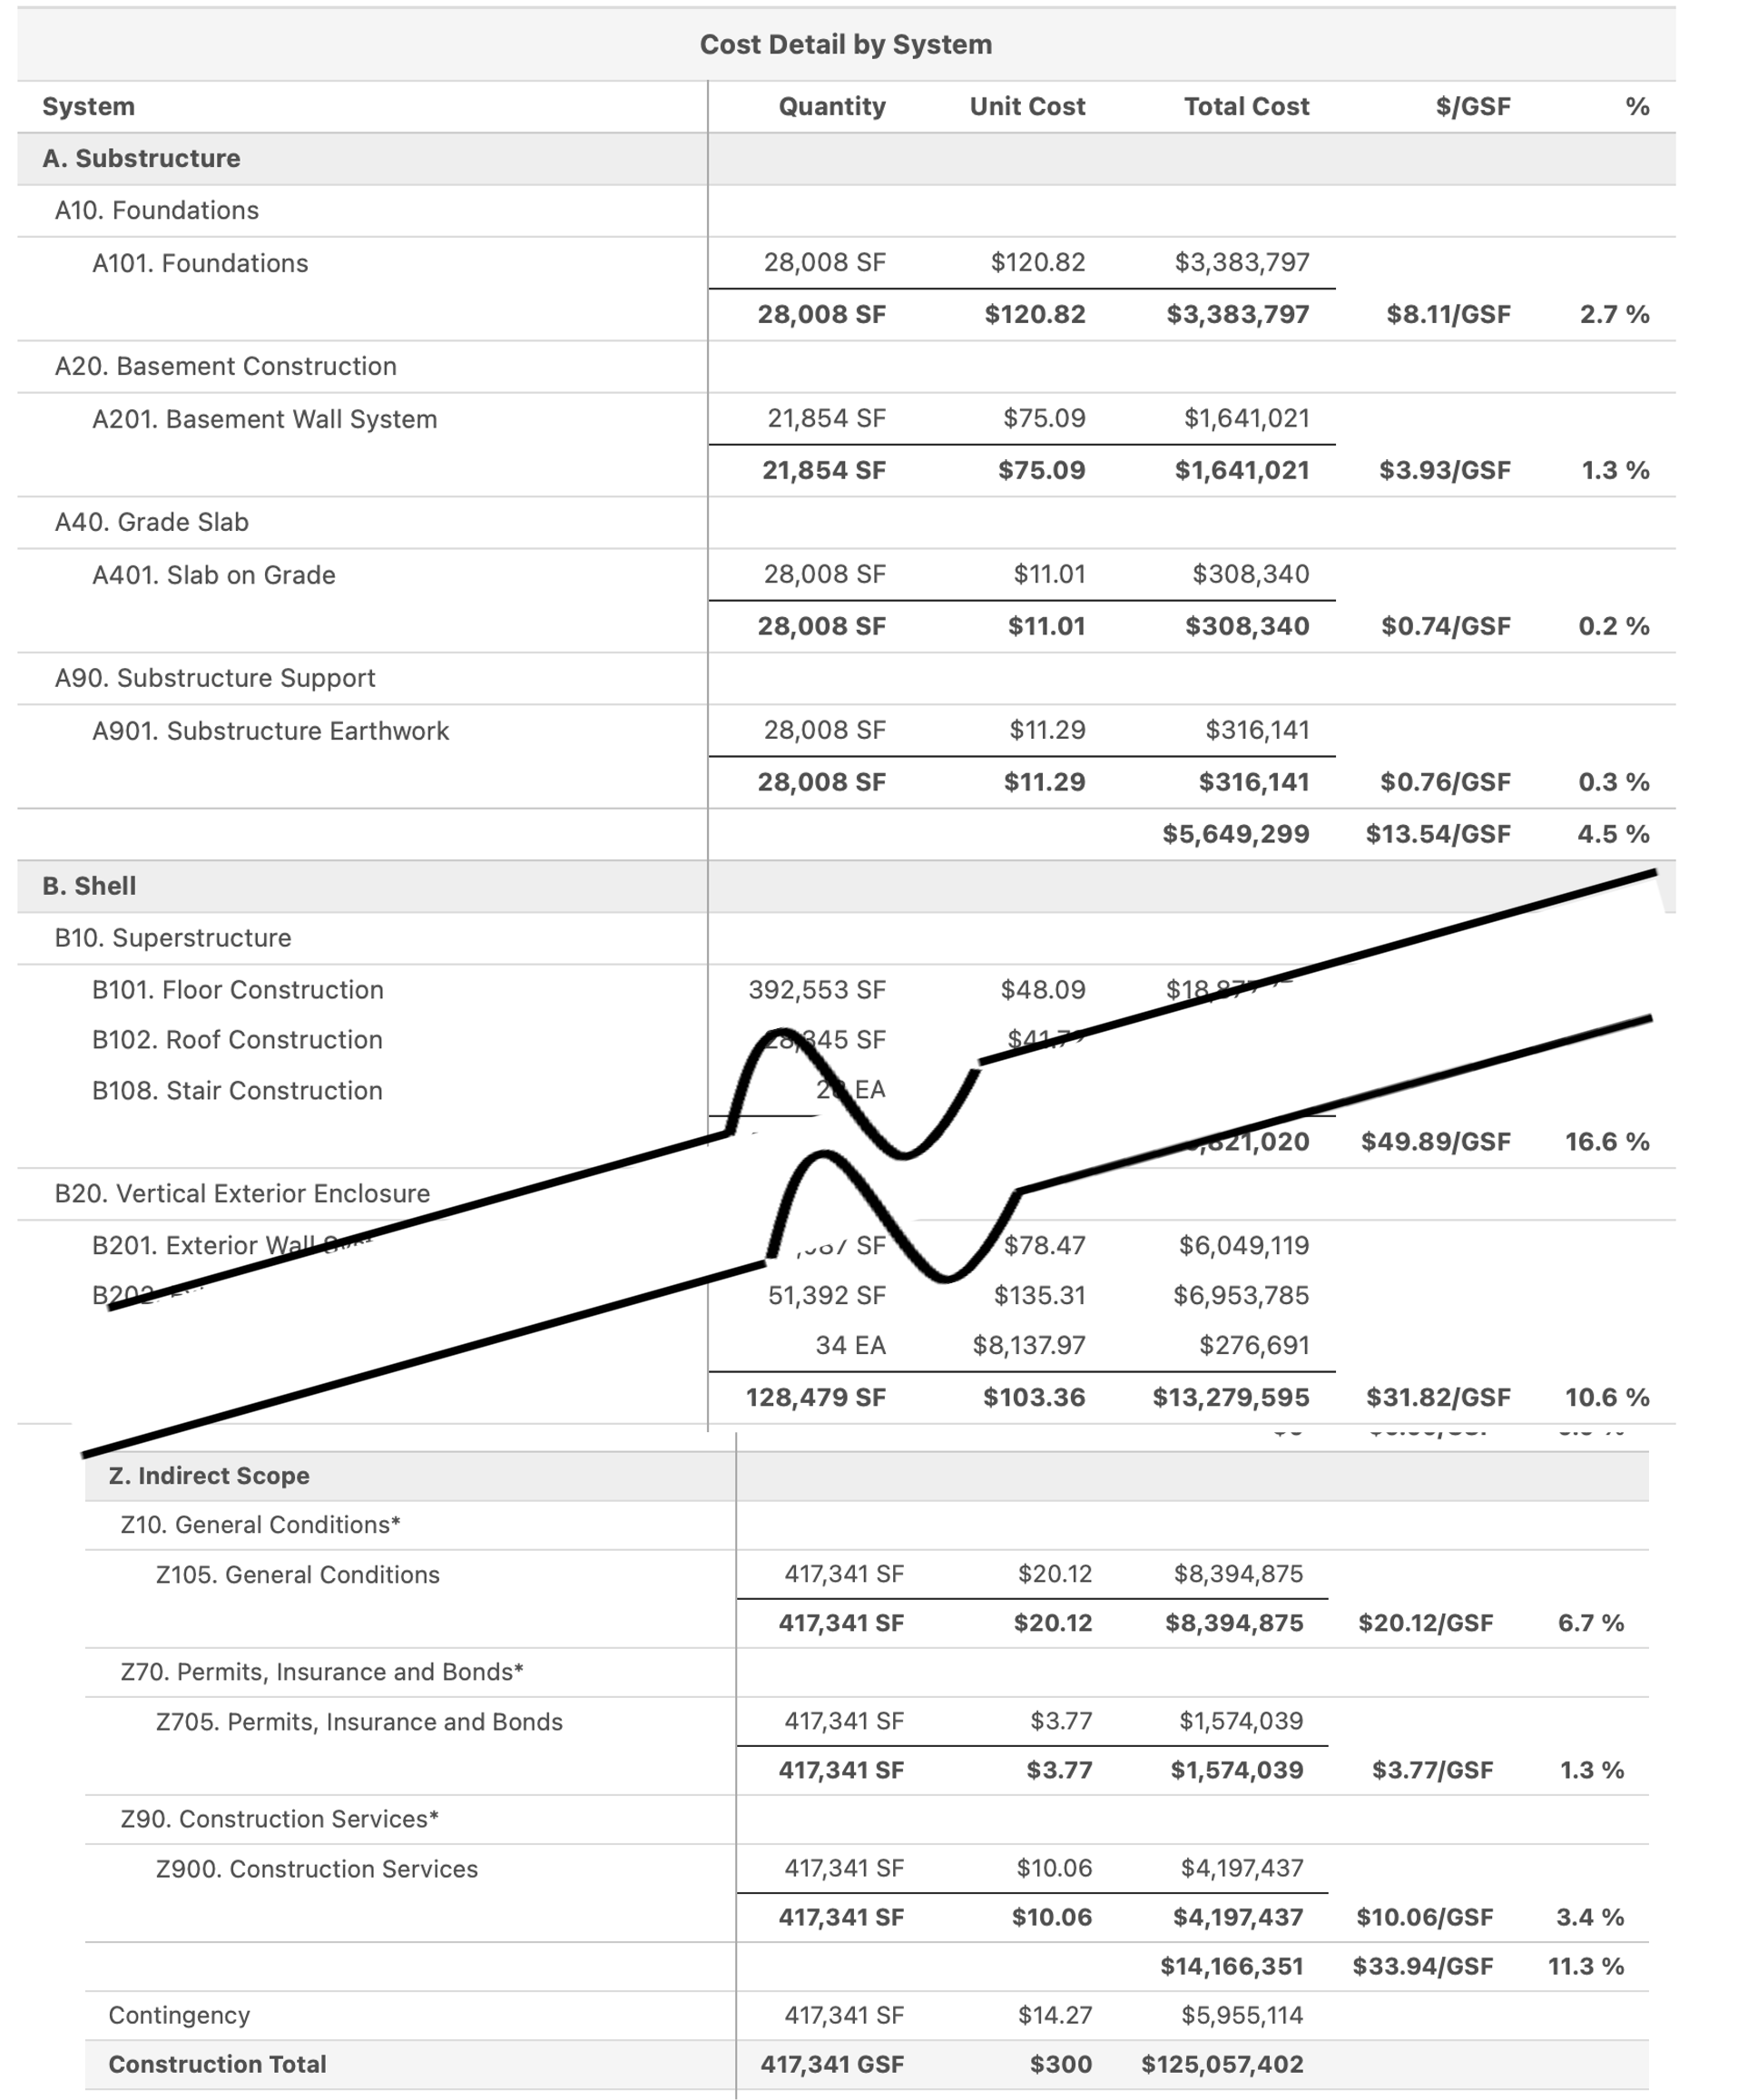
Again, even in the early planning or feasibility stages, CATALYST produces a comprehensive cost model, that is structured like a convention cost estimate. You will also recall that all of the parameters (quantities) and costs are easily revisable – as show in the How page.
Comparison Reports and Dashboard
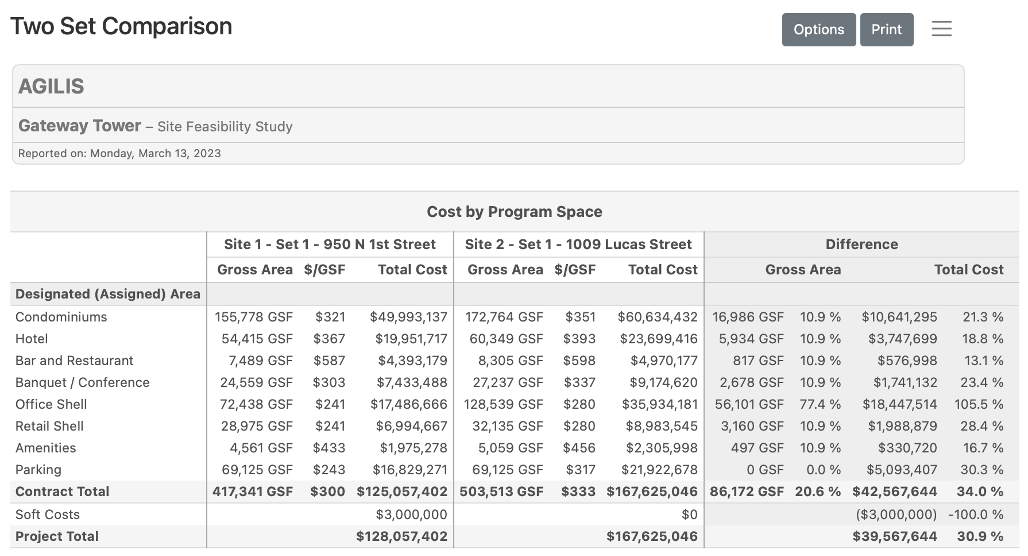
There are a variety of ways to compare Project Sets – which is essential to decision-making. Let’s start with the Two-set Comparison. This report has three sections:
- Program Cost
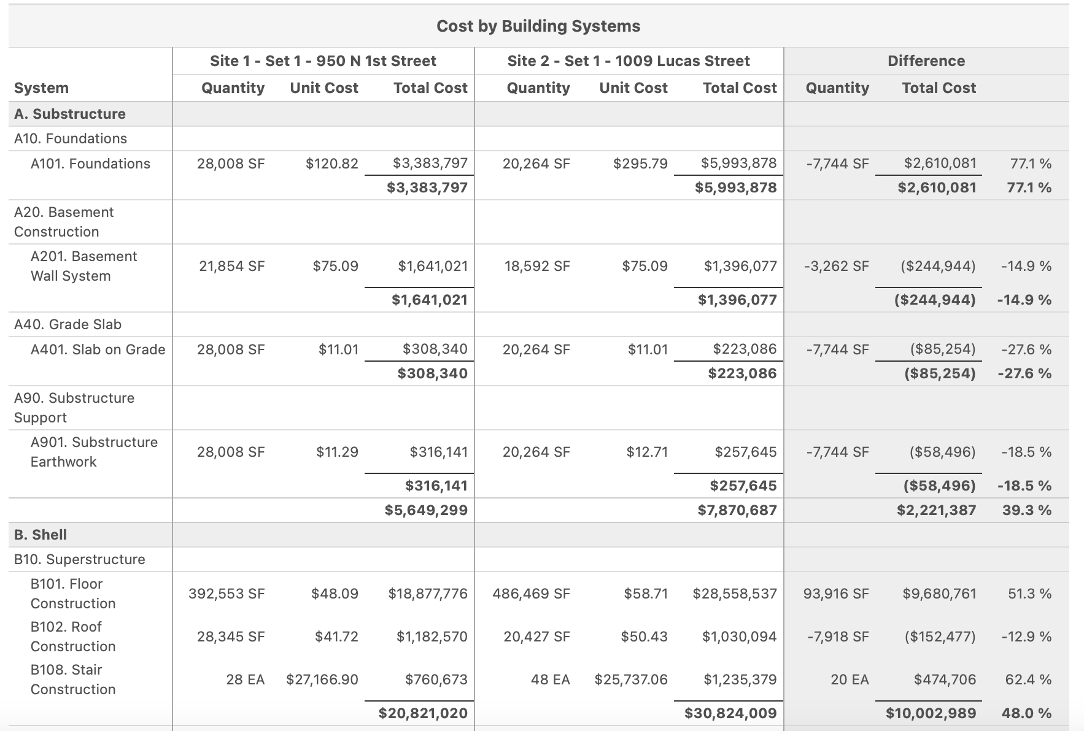
- System Cost
- Parameter
- Schedule
- Attribute
Here we see the Program comparison that shows both the area and cost – all rolled up into the various Departments (or Functional Groups). Following that is the System-by-System comparison excerpt.
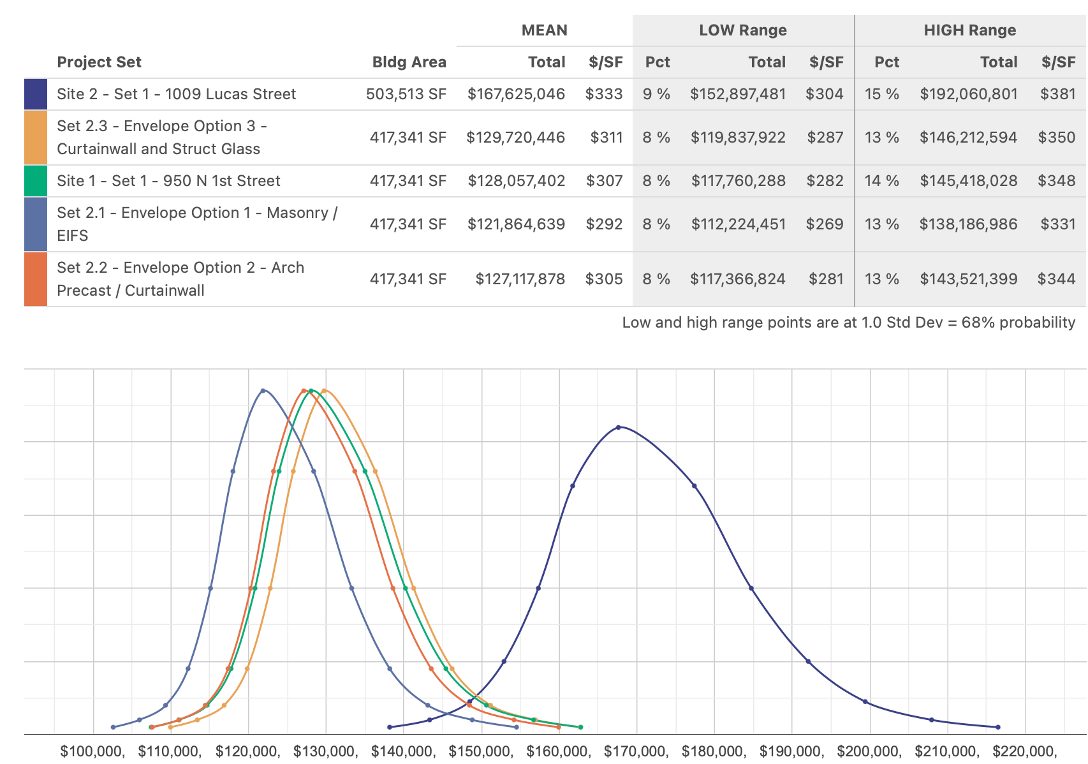
The Variation by System displays the cost outcomes in a statistical bell-curve form with the cost on the horizontal axis and the distribution density on the vertical access. These curves show a wider range associated with the early planning process. As more information regarding program and design is entered into the system the range of variation reduces and the probability density increases.
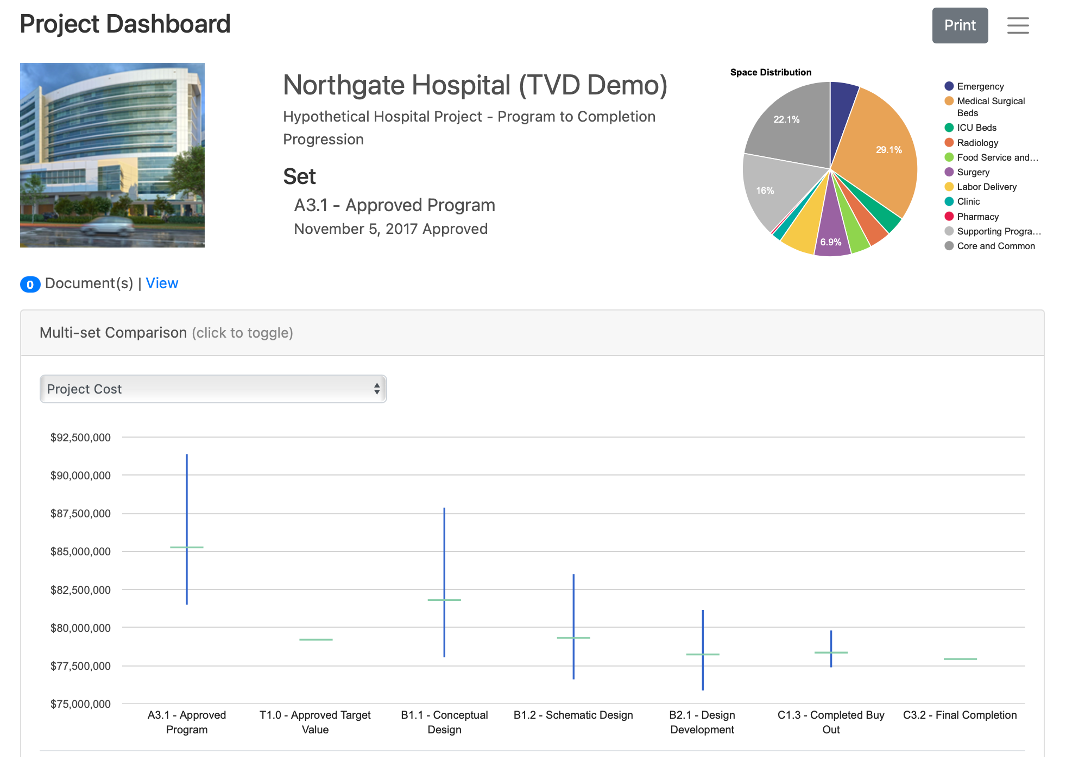
The Project Dashboard can display multiple sets. In this case the seven milestones from Approved Program to Final Completion. This provides a graphical representation of the steering progress to toward the approved target value or budget. This shows the total project cost, but any building system can be selected for comparison.
Building CATALYST provides an Enterprise Analysis feature that compares Project Sets across, within, or a mix. These graphs show five completed rehabilitation hospitals – normalized to the same time and location. The right side compares key metrics. The left side compares costs per metric. For each set, the upper outlined bar represents the CATALYST prediction. The lower filled-in bar represents the actual results. The patterns of variation tell an amazing story, and help set objective standards from which to measure value of current projects.
The first graph compares the total net to gross building, and construction cost per gross building area. Any building system could be displayed as well. The second graph shows the predominate function in a hospital, the patient bed. Various rehab treatment functions and spaces can also be compared. The remarkable thing is how close the prediction and actual results are. This is possible by collecting dozens of data entities that define projects.
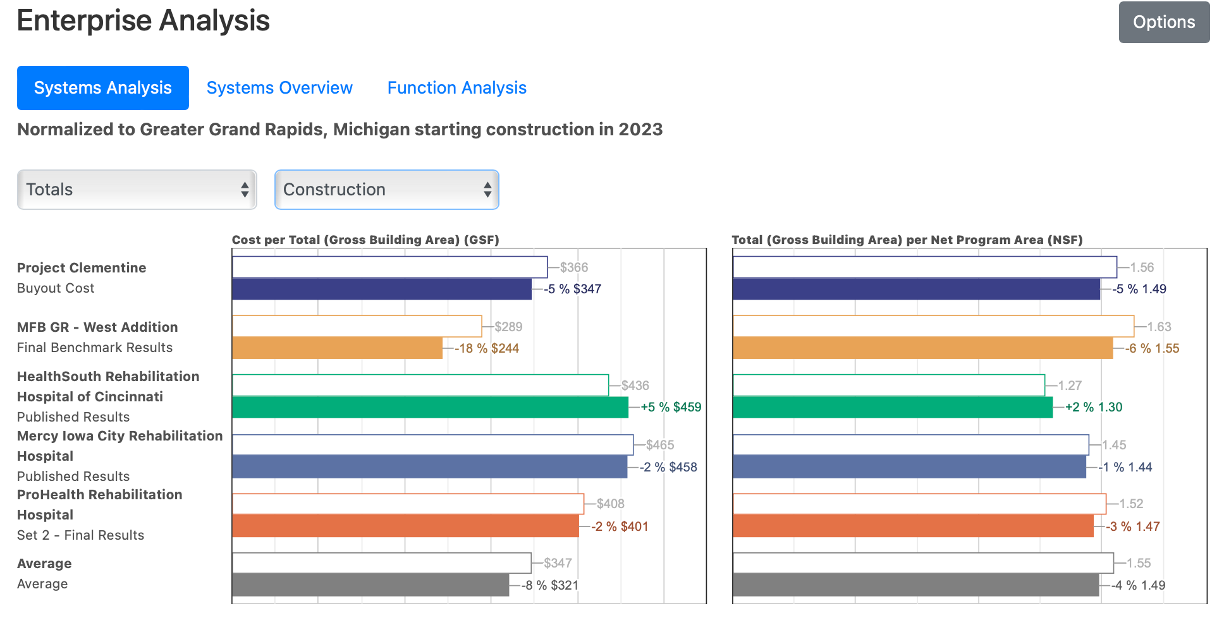
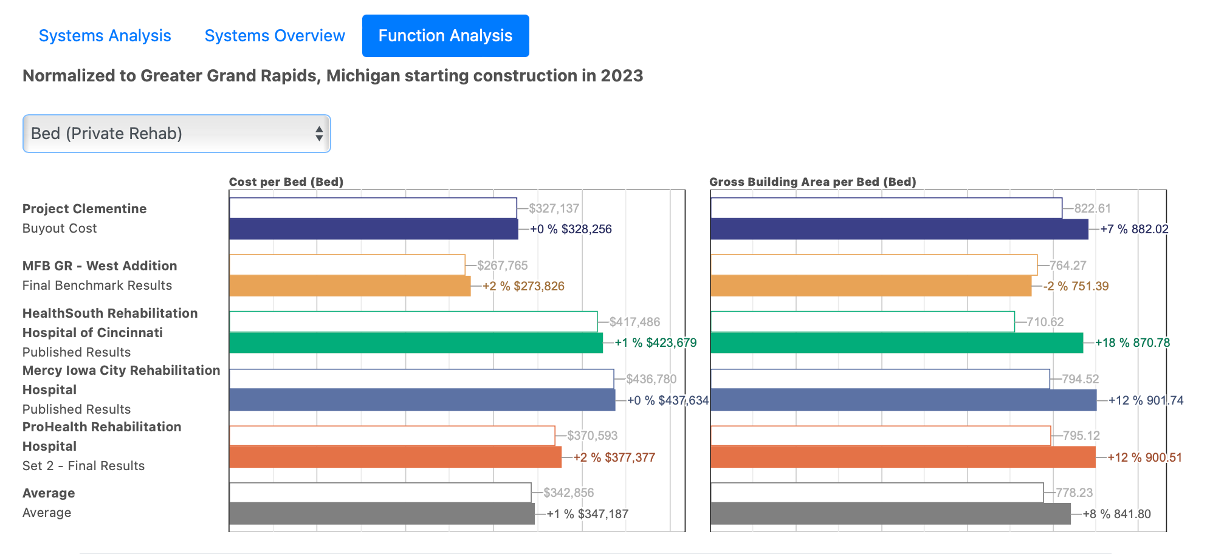
The Enterpise Analysis becomes a powerful comparison tool as your data from past projects is entered into the system.
Process Integration: Data to Geometric Modeling Example
Building CATALYST is not an be-all-end-all tool, but rather serves as starting point for project planning and cost management. It also provides an integration hub for the “nucleus of critical data” from which other technical solutions and processes can be organized.
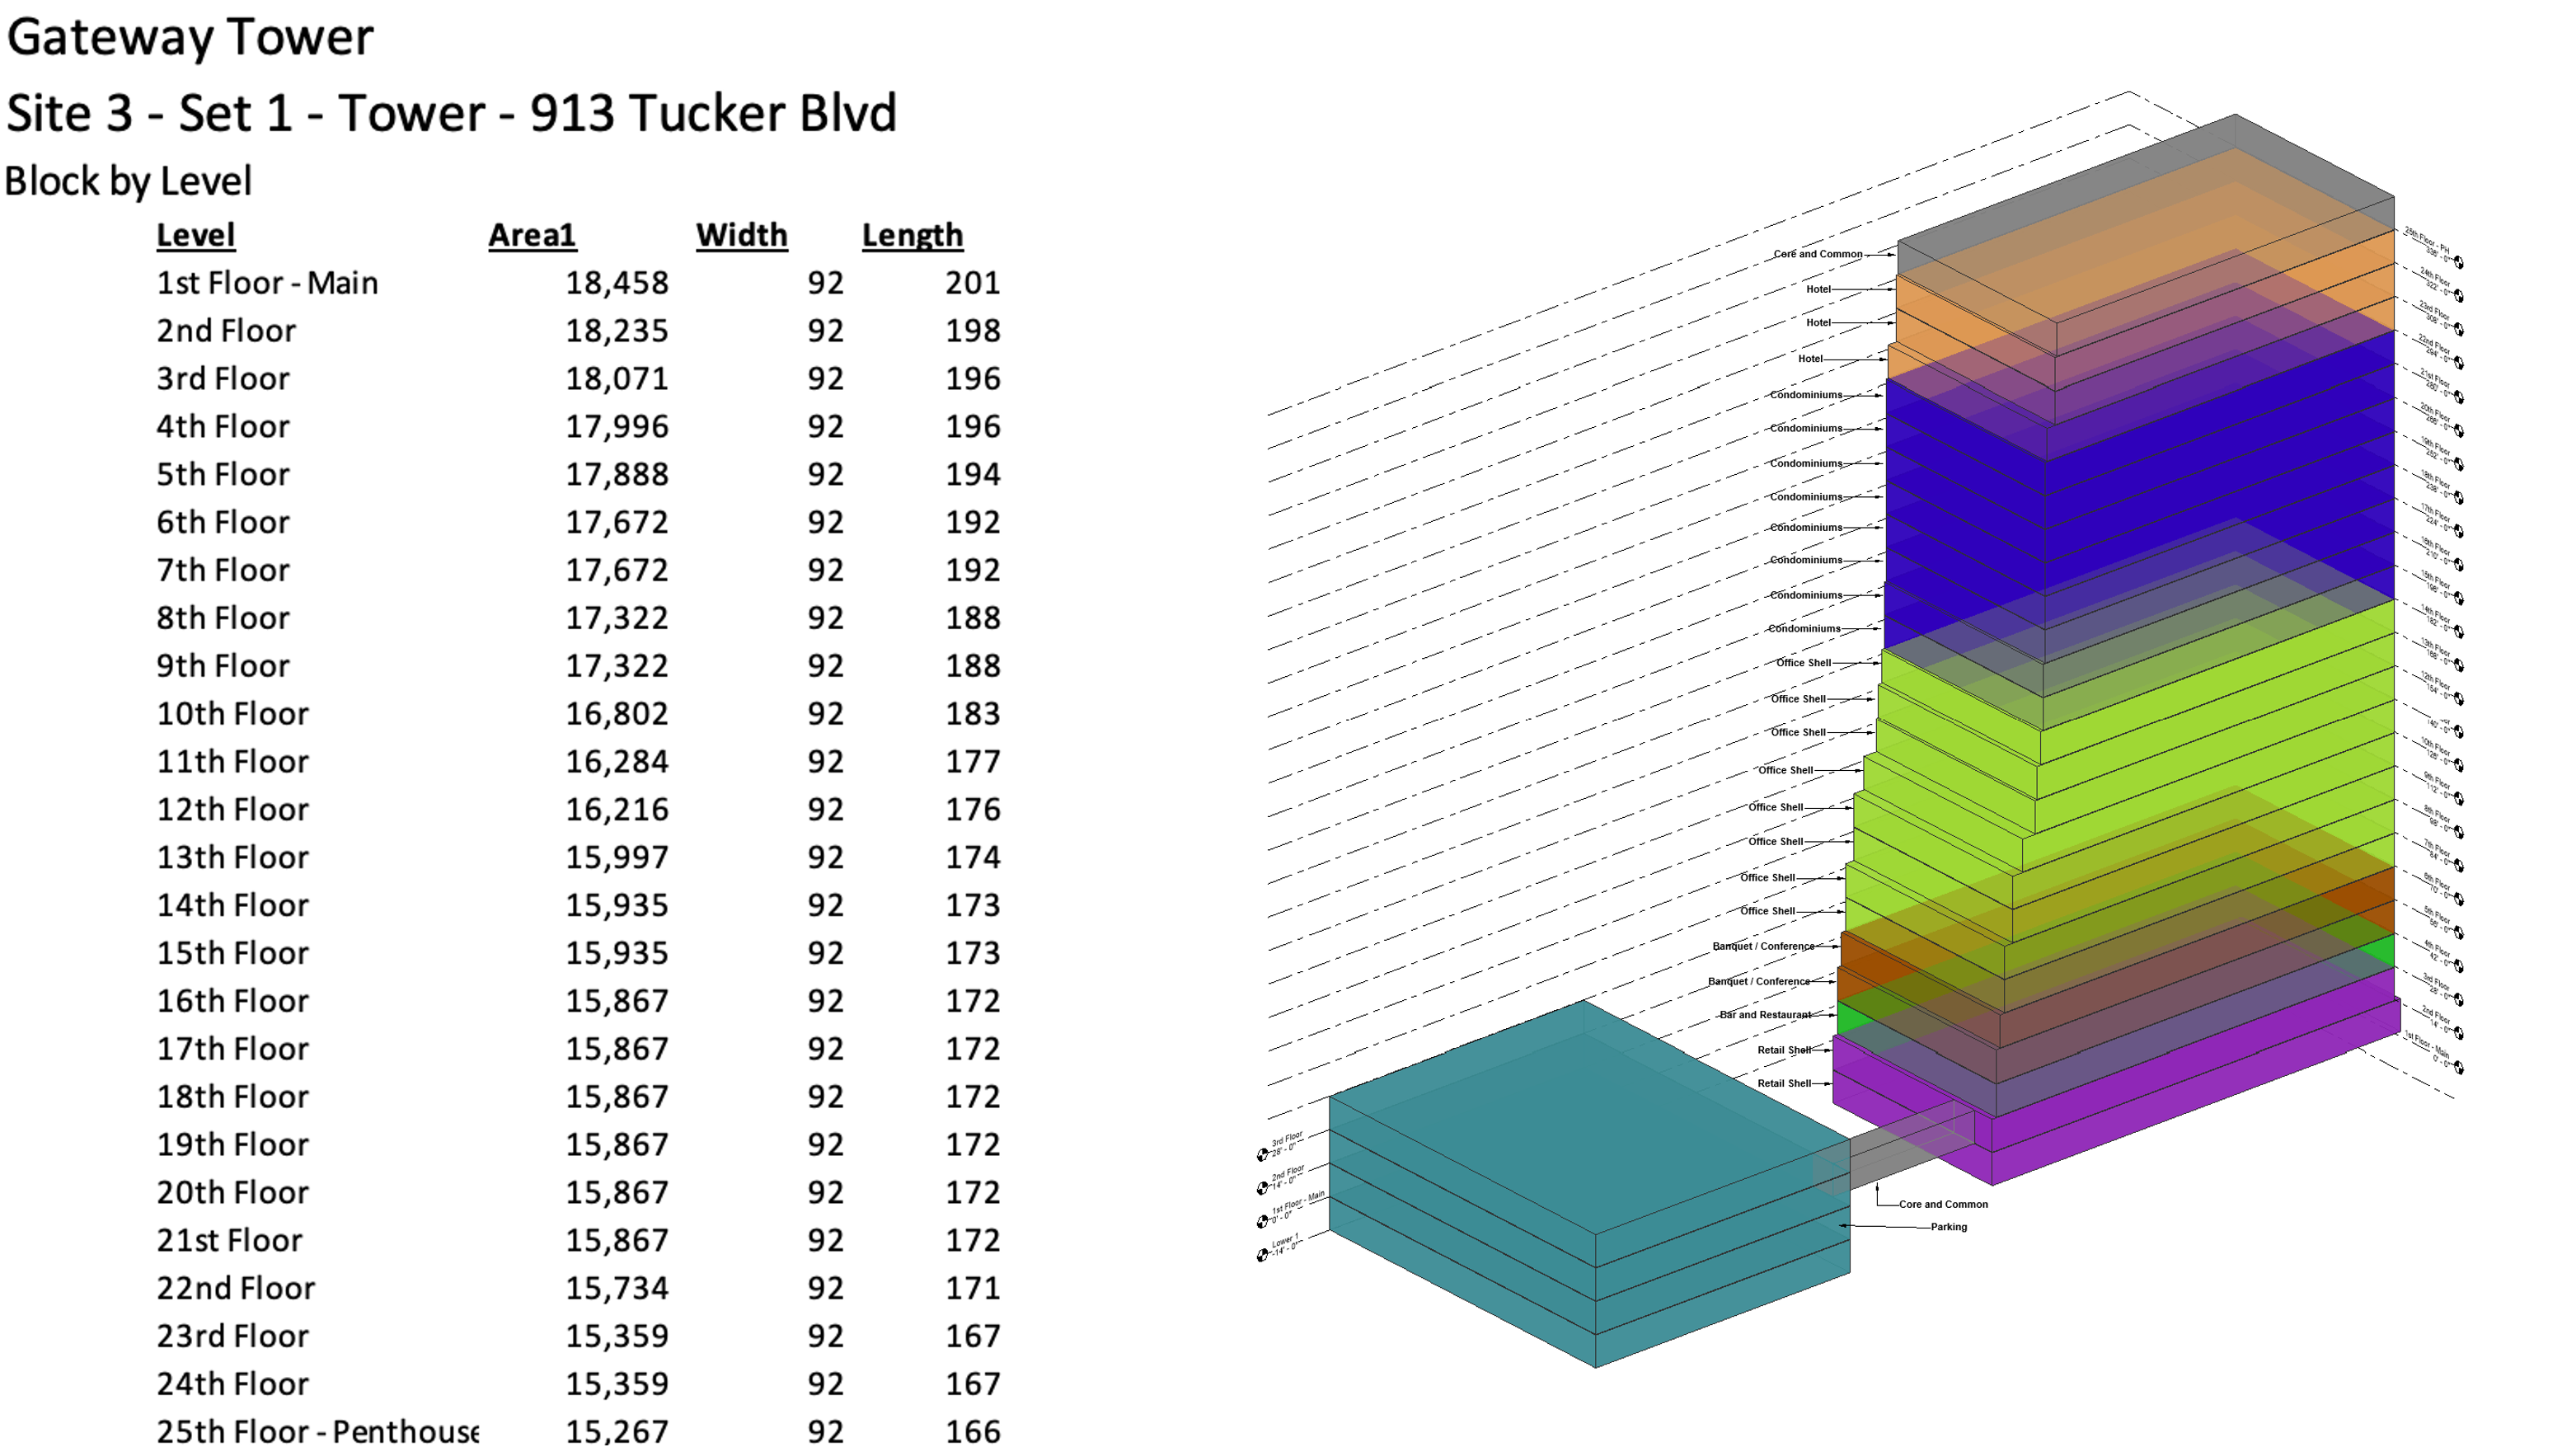
The superset approach can be illustrated here. The Site 3 example includes three building types (Tower, Parking, Skywalk) as shown below. These sub-projects are modeled independently and then merged into one master project.
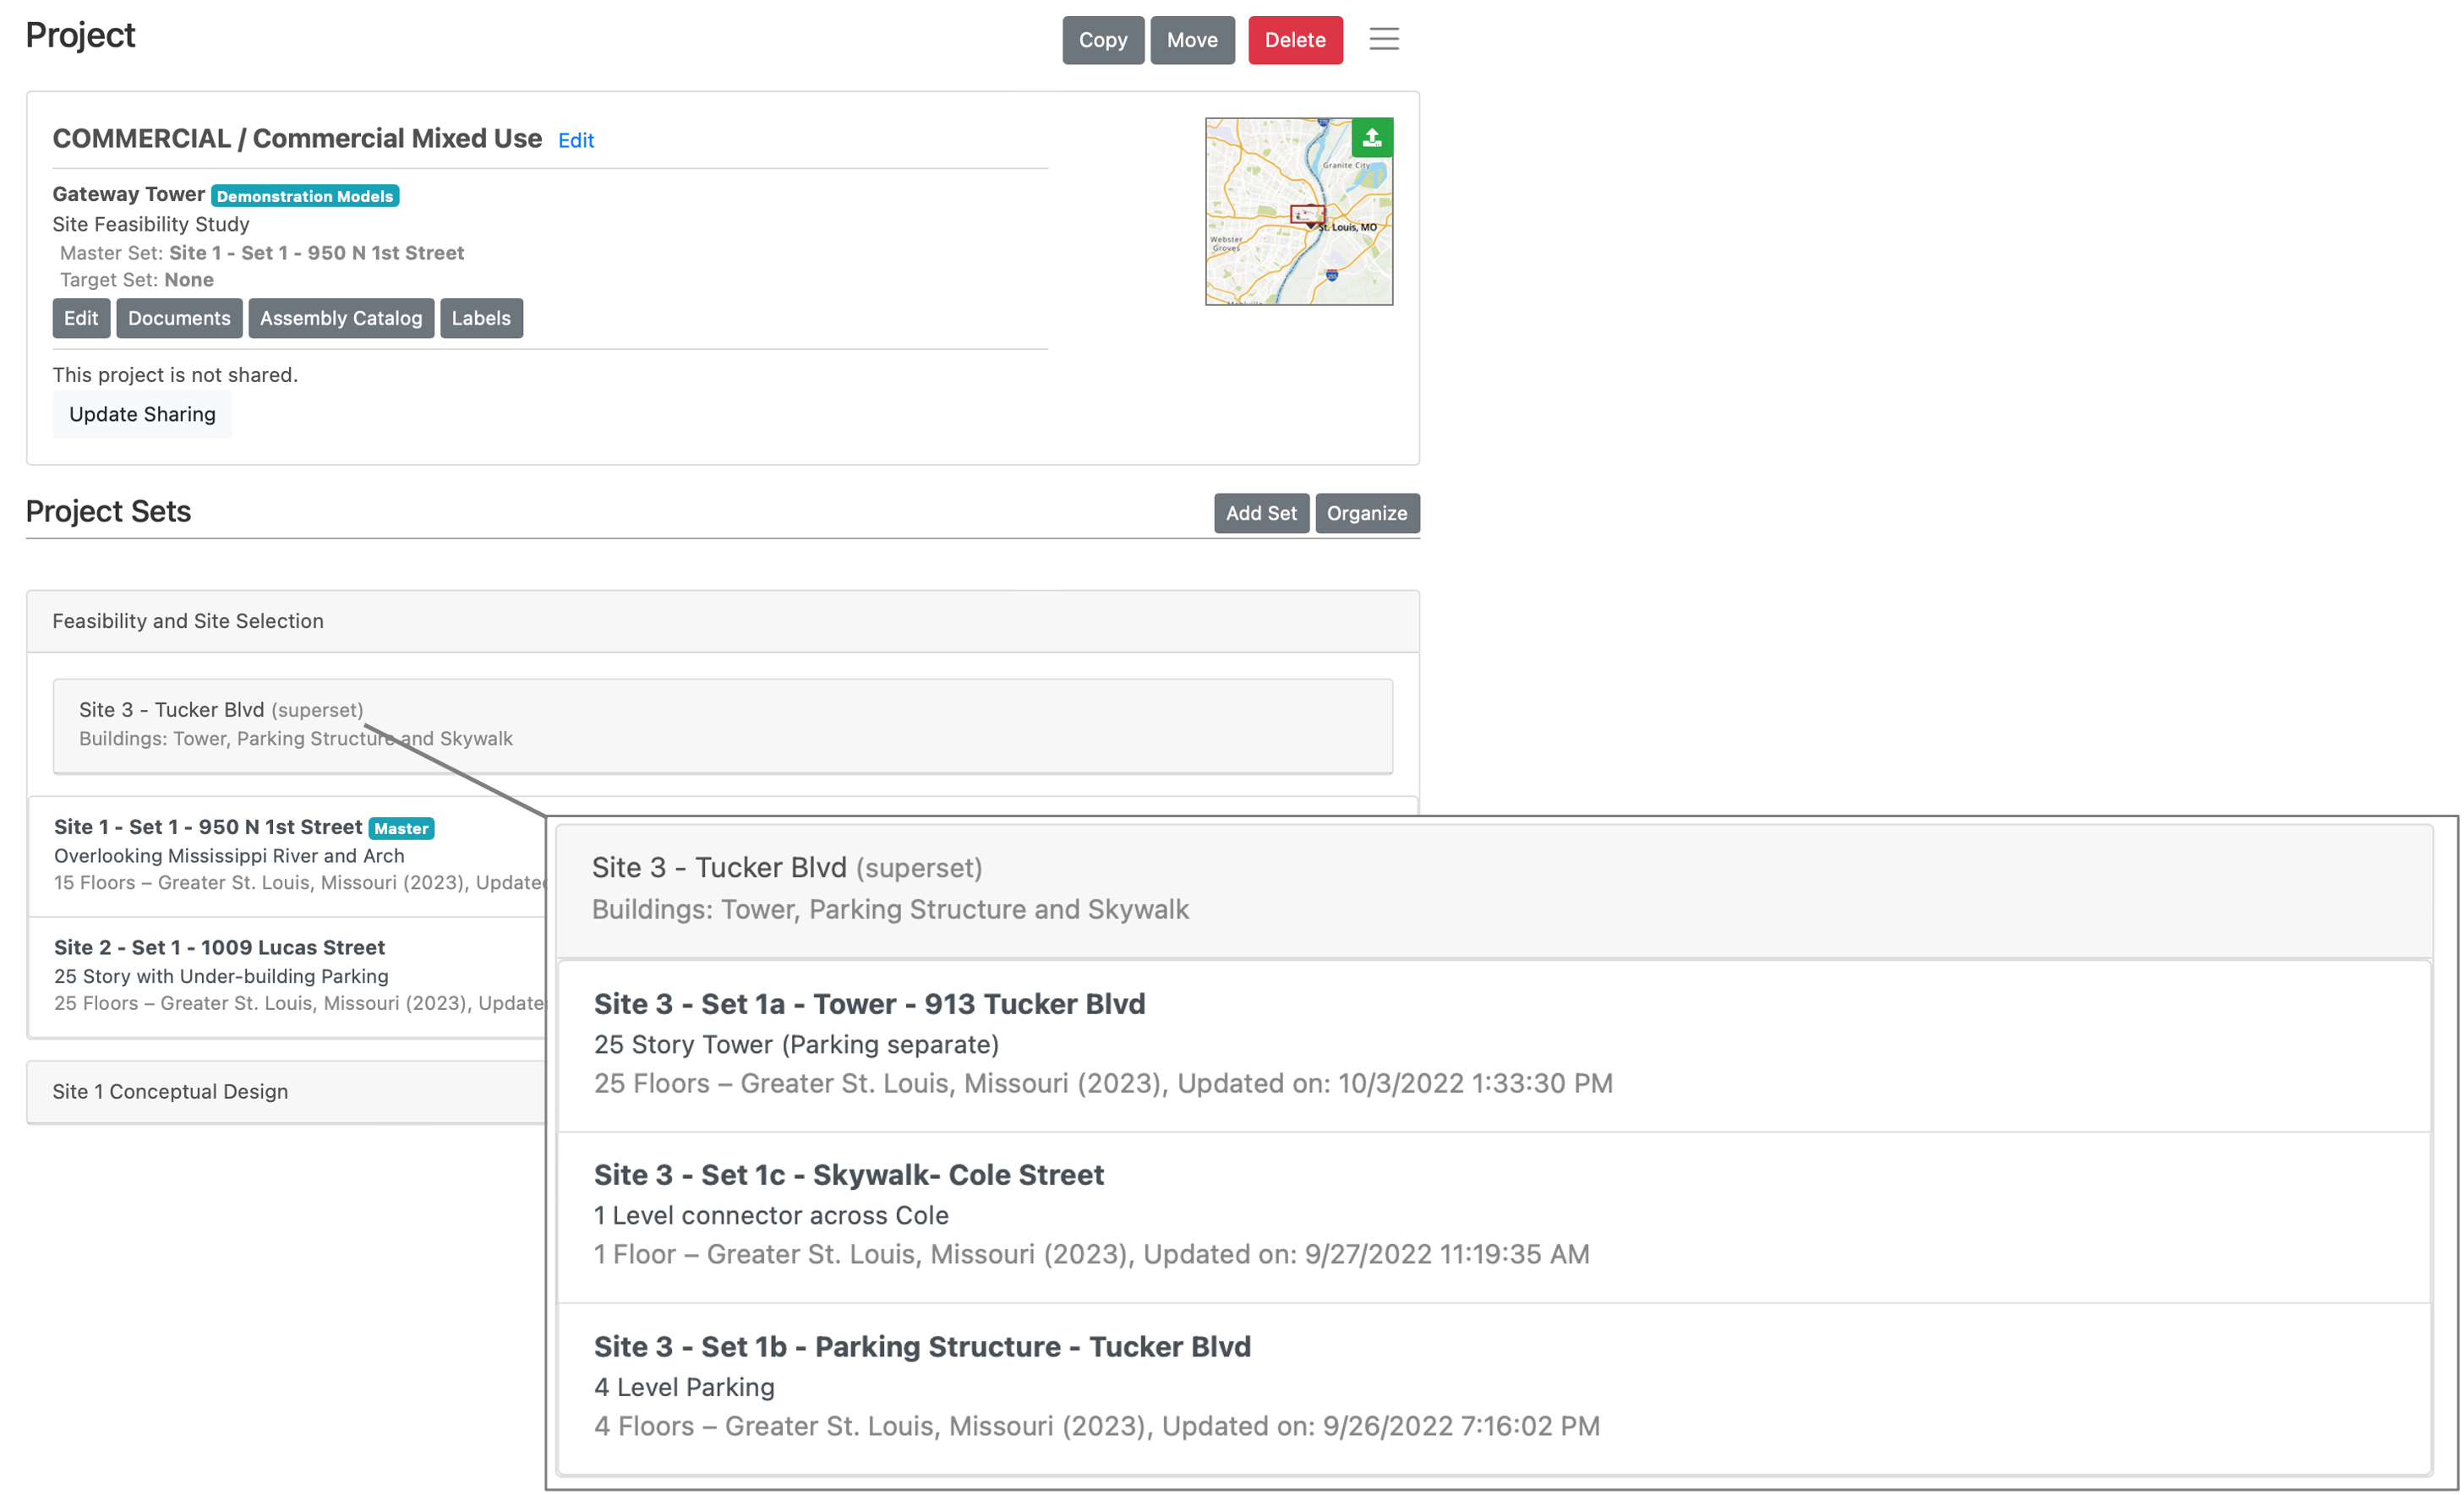
The Export feature of Building CATALYST is currently Excel-based, though API data exchange is the goal. Until then there’s a two-step process to Export raw data on one or more Project Sets, and then paste into a pre-developed template. There are a wide range of template applications. In this case we export into a template to assign the CATLAYST program to the floors – and then summarized like this:
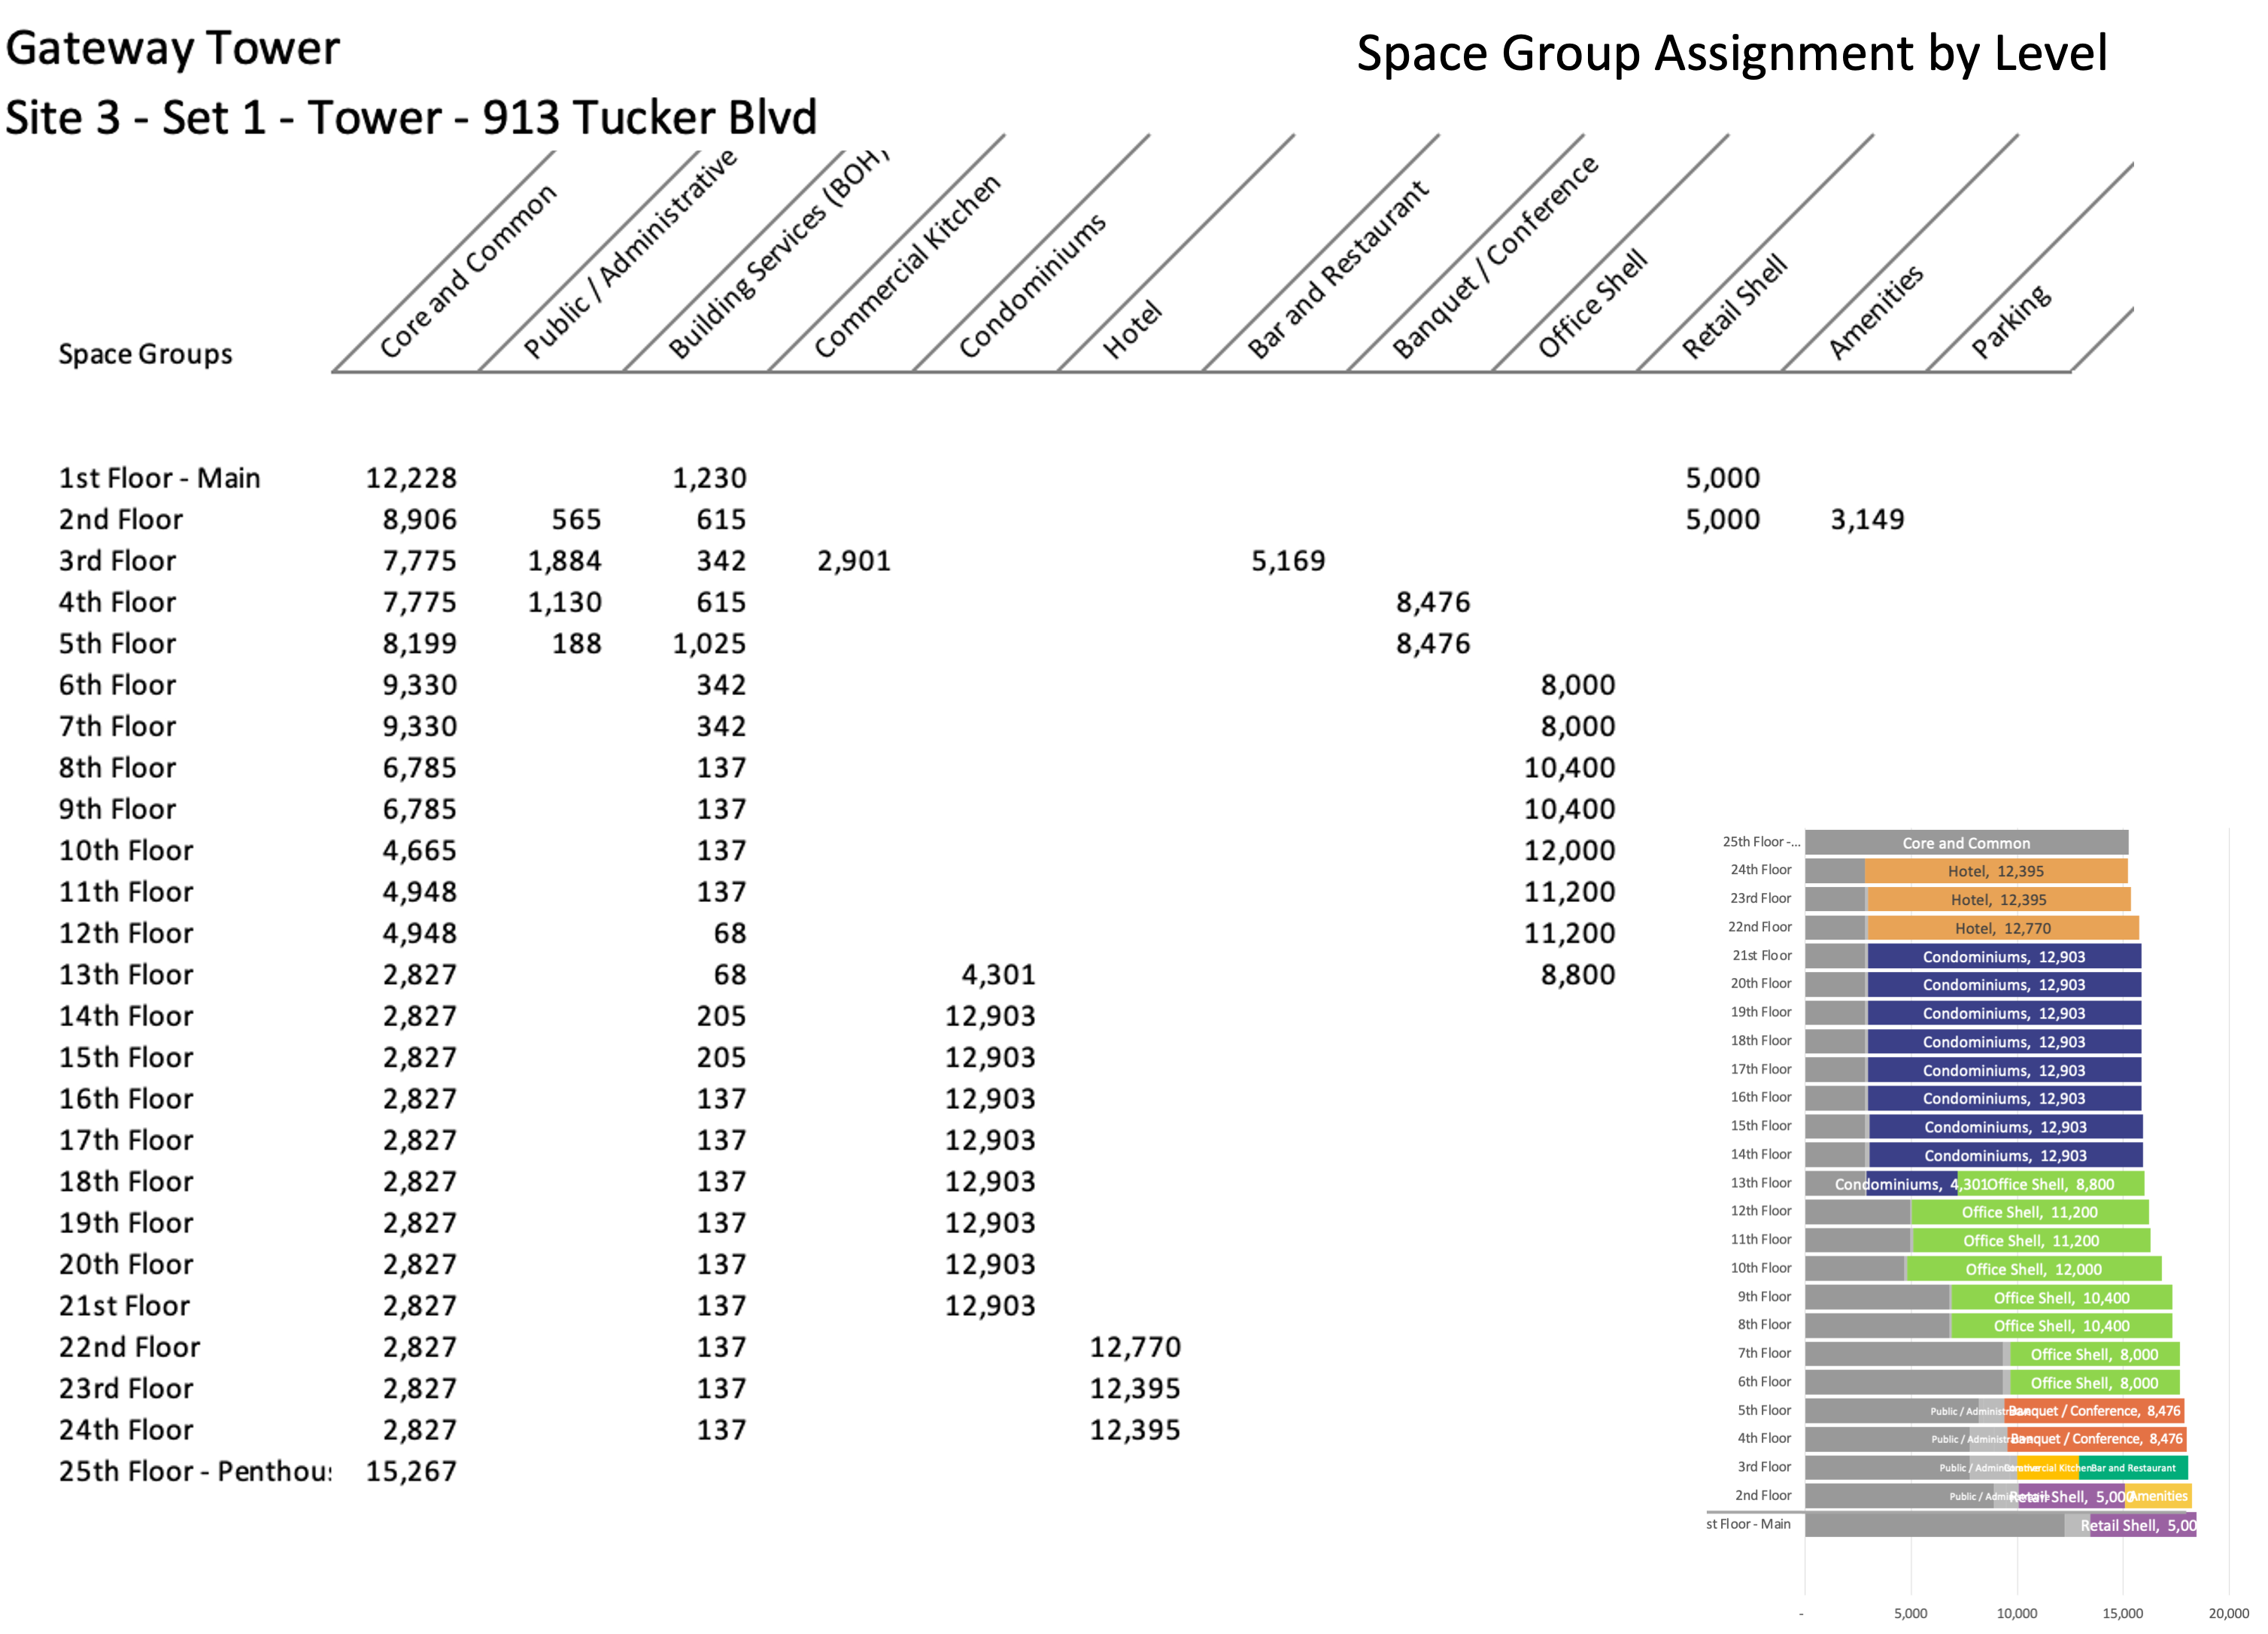 From here, the floor blocks can be exported into Revit, as shown in this first figure, and then place onto a real site in Infraworks (Courtesy of Mark Dietrick, AIA - Case Technologies). These block massing models can be done in a fraction of the time that conventional practices take.
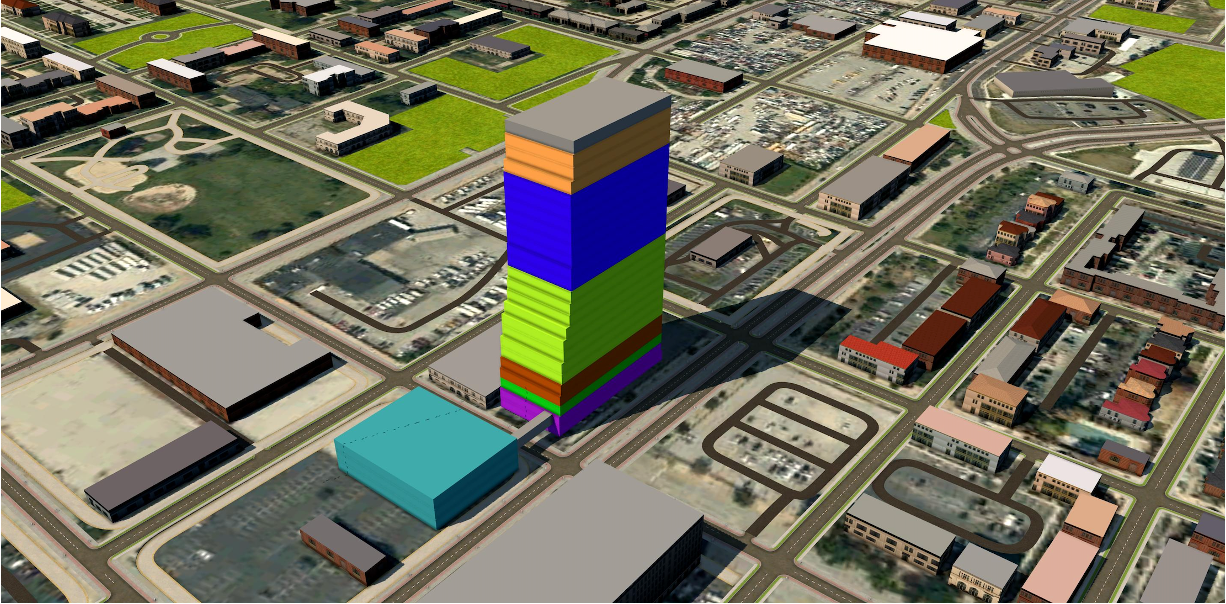
Toyota’s Production System applied set-based design, enabled Toyota to prototype five whole auto concepts in the time that it took other manufactures to produce on prototype. The combination of CATALSYT, Revit and Infraworks provides a major step toward achieving the same type of production.
____________________________________________________________________
End Notes:
(1) Report Selection:
